On-campus Sexual Assault Statistics Head to Head
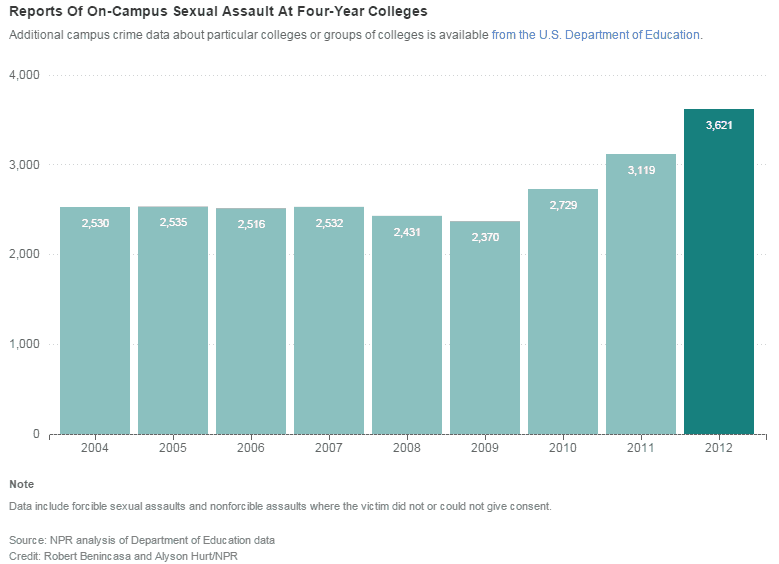
row]column]column_text]In recent months, U.S. colleges have come under heavy scrutiny regarding sexual assault. University crimes in every category have decreased, but the number of reported on-campus sexual assaults across the U.S. has not followed suit and is up 50% over the course of the last decade.
A 2014 report released by the U.S. government revealed a chilling fact:
[bctt tweet="One in five college students experiences sexual assault during their college career."]
In light of the increasing numbers, EDsmart staff thought it would be interesting to see the statistical differences between Princeton Reviews top-ranked schools versus their counterparts in terms of reported sexual assaults of each. The findings were a bit alarming for some of the school types. The data critical to this study is accessible in the "Data Sets" section, positioned at the conclusion of this research. All data comes from Princeton Review and College Navigator.
Together with this study we've incorporated additional statistical data regarding sexual assault incidents in colleges that have direct or indirect relevance to the topic. column_text]column]row]row]column width="1/2" css=".vc_custom_1426138611311{border-top-width: 20px !important;border-right-width: 20px !important;border-bottom-width: 20px !important;border-left-width: 20px !important;border-left-color: #efefef !important;border-left-style: solid !important;border-right-color: #efefef !important;border-right-style: solid !important;border-top-color: #efefef !important;border-top-style: solid !important;border-bottom-color: #efefef !important;border-bottom-style: solid !important;}"]custom_heading text="Party Schools" font_container="tag:h2|font_size:64px|text_align:center" google_fonts="font_family:Cinzel%3Aregular%2C700%2C900|font_style:400%20regular%3A400%3Anormal"]custom_heading text="0.07%" font_container="tag:h2|font_size:48px|text_align:center|color:%23dd3333" google_fonts="font_family:Lato%3A100%2C100italic%2C300%2C300italic%2Cregular%2Citalic%2C700%2C700italic%2C900%2C900italic|font_style:900%20bold%20italic%3A900%3Aitalic" css=".vc_custom_1426140956763{border-bottom-width: 20px !important;padding-top: 29px !important;background-color: #000000 !important;border-bottom-color: #000000 !important;border-bottom-style: solid !important;}"]column]column width="1/2" css=".vc_custom_1426138626593{border-top-width: 20px !important;border-right-width: 20px !important;border-bottom-width: 20px !important;border-left-width: 20px !important;border-left-color: #efefef !important;border-left-style: solid !important;border-right-color: #efefef !important;border-right-style: solid !important;border-top-color: #efefef !important;border-top-style: solid !important;border-bottom-color: #efefef !important;border-bottom-style: solid !important;}"]custom_heading text="Stone-Cold-Sober Schools" font_container="tag:h2|font_size:64px|text_align:center" google_fonts="font_family:Cinzel%3Aregular%2C700%2C900|font_style:400%20regular%3A400%3Anormal"]custom_heading text="0.01%" font_container="tag:h2|font_size:48px|text_align:center|color:%2381d742" google_fonts="font_family:Lato%3A100%2C100italic%2C300%2C300italic%2Cregular%2Citalic%2C700%2C700italic%2C900%2C900italic|font_style:900%20bold%20italic%3A900%3Aitalic" css=".vc_custom_1426141062382{border-bottom-width: 20px !important;background-color: #000000 !important;border-bottom-color: #000000 !important;border-bottom-style: solid !important;}"]column]row]row]column]custom_heading text="Party Schools experience 600% more on-campus sexual assaults than Stone-Cold-Sober schools" font_container="tag:h2|text_align:center|color:%23dd3333" google_fonts="font_family:Lato%3A100%2C100italic%2C300%2C300italic%2Cregular%2Citalic%2C700%2C700italic%2C900%2C900italic|font_style:900%20bold%20regular%3A900%3Anormal"]column_text css=".vc_custom_1426576745720{margin-top: -20px !important;}"]
column_text]column]row]row]column width="1/2" css=".vc_custom_1426138611311{border-top-width: 20px !important;border-right-width: 20px !important;border-bottom-width: 20px !important;border-left-width: 20px !important;border-left-color: #efefef !important;border-left-style: solid !important;border-right-color: #efefef !important;border-right-style: solid !important;border-top-color: #efefef !important;border-top-style: solid !important;border-bottom-color: #efefef !important;border-bottom-style: solid !important;}"]custom_heading text="Least Religious Schools" font_container="tag:h2|font_size:64px|text_align:center" google_fonts="font_family:Cinzel%3Aregular%2C700%2C900|font_style:400%20regular%3A400%3Anormal"]custom_heading text="0.35%" font_container="tag:h2|font_size:48px|text_align:center|color:%23dd3333" google_fonts="font_family:Lato%3A100%2C100italic%2C300%2C300italic%2Cregular%2Citalic%2C700%2C700italic%2C900%2C900italic|font_style:900%20bold%20italic%3A900%3Aitalic" css=".vc_custom_1426140987420{border-bottom-width: 20px !important;background-color: #000000 !important;border-bottom-color: #000000 !important;border-bottom-style: solid !important;}"]column]column width="1/2" css=".vc_custom_1426138626593{border-top-width: 20px !important;border-right-width: 20px !important;border-bottom-width: 20px !important;border-left-width: 20px !important;border-left-color: #efefef !important;border-left-style: solid !important;border-right-color: #efefef !important;border-right-style: solid !important;border-top-color: #efefef !important;border-top-style: solid !important;border-bottom-color: #efefef !important;border-bottom-style: solid !important;}"]custom_heading text="Most Religious Schools" font_container="tag:h2|font_size:64px|text_align:center" google_fonts="font_family:Cinzel%3Aregular%2C700%2C900|font_style:400%20regular%3A400%3Anormal"]custom_heading text="0.01%" font_container="tag:h2|font_size:48px|text_align:center|color:%2381d742" google_fonts="font_family:Lato%3A100%2C100italic%2C300%2C300italic%2Cregular%2Citalic%2C700%2C700italic%2C900%2C900italic|font_style:900%20bold%20italic%3A900%3Aitalic" css=".vc_custom_1426141023422{border-bottom-width: 20px !important;border-bottom-color: #000000 !important;border-bottom-style: solid !important;}"]column]row]row]column]column_text css=".vc_custom_1426576810186{margin-top: -20px !important;}"]
column_text]custom_heading text="The Least Religious schools experience 3400% more on-campus sexual assaults than the Most Religious schools" font_container="tag:h2|text_align:center|color:%23dd3333" google_fonts="font_family:Lato%3A100%2C100italic%2C300%2C300italic%2Cregular%2Citalic%2C700%2C700italic%2C900%2C900italic|font_style:900%20bold%20regular%3A900%3Anormal"]column]row]row]column width="1/2" css=".vc_custom_1426138611311{border-top-width: 20px !important;border-right-width: 20px !important;border-bottom-width: 20px !important;border-left-width: 20px !important;border-left-color: #efefef !important;border-left-style: solid !important;border-right-color: #efefef !important;border-right-style: solid !important;border-top-color: #efefef !important;border-top-style: solid !important;border-bottom-color: #efefef !important;border-bottom-style: solid !important;}"]custom_heading text="Most Liberal Students" font_container="tag:h2|font_size:64px|text_align:center" google_fonts="font_family:Cinzel%3Aregular%2C700%2C900|font_style:400%20regular%3A400%3Anormal"]custom_heading text="0.38%" font_container="tag:h2|font_size:48px|text_align:center|color:%23dd3333" google_fonts="font_family:Lato%3A100%2C100italic%2C300%2C300italic%2Cregular%2Citalic%2C700%2C700italic%2C900%2C900italic|font_style:900%20bold%20italic%3A900%3Aitalic" css=".vc_custom_1426141035073{border-bottom-width: 20px !important;padding-top: 29px !important;background-color: #000000 !important;border-bottom-color: #000000 !important;border-bottom-style: solid !important;}"]column]column width="1/2" css=".vc_custom_1426138626593{border-top-width: 20px !important;border-right-width: 20px !important;border-bottom-width: 20px !important;border-left-width: 20px !important;border-left-color: #efefef !important;border-left-style: solid !important;border-right-color: #efefef !important;border-right-style: solid !important;border-top-color: #efefef !important;border-top-style: solid !important;border-bottom-color: #efefef !important;border-bottom-style: solid !important;}"]custom_heading text="Most Conservative Students" font_container="tag:h2|font_size:64px|text_align:center" google_fonts="font_family:Cinzel%3Aregular%2C700%2C900|font_style:400%20regular%3A400%3Anormal"]custom_heading text="0.02%" font_container="tag:h2|font_size:48px|text_align:center|color:%2381d742" google_fonts="font_family:Lato%3A100%2C100italic%2C300%2C300italic%2Cregular%2Citalic%2C700%2C700italic%2C900%2C900italic|font_style:900%20bold%20italic%3A900%3Aitalic" css=".vc_custom_1426139173785{border-bottom-width: 20px !important;border-bottom-color: #000000 !important;border-bottom-style: solid !important;}"]column]row]row]column]custom_heading text="The Most Liberal Student schools experience 1800% more on-campus sexual assaults than the Most Conservative Student schools" font_container="tag:h2|text_align:center|color:%23dd3333" google_fonts="font_family:Lato%3A100%2C100italic%2C300%2C300italic%2Cregular%2Citalic%2C700%2C700italic%2C900%2C900italic|font_style:900%20bold%20regular%3A900%3Anormal"]column_text css=".vc_custom_1426576849599{margin-top: -20px !important;}"]
column_text]column]row]row]column width="1/2" css=".vc_custom_1426138611311{border-top-width: 20px !important;border-right-width: 20px !important;border-bottom-width: 20px !important;border-left-width: 20px !important;border-left-color: #efefef !important;border-left-style: solid !important;border-right-color: #efefef !important;border-right-style: solid !important;border-top-color: #efefef !important;border-top-style: solid !important;border-bottom-color: #efefef !important;border-bottom-style: solid !important;}"]custom_heading text="Lots of Hard Liquor" font_container="tag:h2|font_size:64px|text_align:center" google_fonts="font_family:Cinzel%3Aregular%2C700%2C900|font_style:400%20regular%3A400%3Anormal"]custom_heading text="0.10%" font_container="tag:h2|font_size:48px|text_align:center|color:%23dd3333" google_fonts="font_family:Lato%3A100%2C100italic%2C300%2C300italic%2Cregular%2Citalic%2C700%2C700italic%2C900%2C900italic|font_style:900%20bold%20italic%3A900%3Aitalic" css=".vc_custom_1426569561246{border-bottom-width: 20px !important;padding-top: 29px !important;background-color: #000000 !important;border-bottom-color: #000000 !important;border-bottom-style: solid !important;}"]column]column width="1/2" css=".vc_custom_1426138626593{border-top-width: 20px !important;border-right-width: 20px !important;border-bottom-width: 20px !important;border-left-width: 20px !important;border-left-color: #efefef !important;border-left-style: solid !important;border-right-color: #efefef !important;border-right-style: solid !important;border-top-color: #efefef !important;border-top-style: solid !important;border-bottom-color: #efefef !important;border-bottom-style: solid !important;}"]custom_heading text="Scotch and Soda, Hold the Scotch" font_container="tag:h2|font_size:64px|text_align:center" google_fonts="font_family:Cinzel%3Aregular%2C700%2C900|font_style:400%20regular%3A400%3Anormal"]custom_heading text="0.03%" font_container="tag:h2|font_size:48px|text_align:center|color:%2381d742" google_fonts="font_family:Lato%3A100%2C100italic%2C300%2C300italic%2Cregular%2Citalic%2C700%2C700italic%2C900%2C900italic|font_style:900%20bold%20italic%3A900%3Aitalic" css=".vc_custom_1426570965659{margin-top: -10px !important;border-bottom-width: 30px !important;border-bottom-color: #000000 !important;border-bottom-style: solid !important;}"]column]row]row]column]custom_heading text="Lots of Hard Liquor schools experience 223.33% more on-campus sexual assaults than Scotch and Soda, Hold the Scotch schools" font_container="tag:h2|text_align:center|color:%23dd3333" google_fonts="font_family:Lato%3A100%2C100italic%2C300%2C300italic%2Cregular%2Citalic%2C700%2C700italic%2C900%2C900italic|font_style:900%20bold%20regular%3A900%3Anormal"]column_text css=".vc_custom_1426576875048{margin-top: -20px !important;}"]
column_text]column]row]row]column width="1/2" css=".vc_custom_1426138611311{border-top-width: 20px !important;border-right-width: 20px !important;border-bottom-width: 20px !important;border-left-width: 20px !important;border-left-color: #efefef !important;border-left-style: solid !important;border-right-color: #efefef !important;border-right-style: solid !important;border-top-color: #efefef !important;border-top-style: solid !important;border-bottom-color: #efefef !important;border-bottom-style: solid !important;}"]custom_heading text="Lots of Beer" font_container="tag:h2|font_size:64px|text_align:center" google_fonts="font_family:Cinzel%3Aregular%2C700%2C900|font_style:400%20regular%3A400%3Anormal"]custom_heading text="0.06%" font_container="tag:h2|font_size:48px|text_align:center|color:%23dd3333" google_fonts="font_family:Lato%3A100%2C100italic%2C300%2C300italic%2Cregular%2Citalic%2C700%2C700italic%2C900%2C900italic|font_style:900%20bold%20italic%3A900%3Aitalic" css=".vc_custom_1426569721271{border-bottom-width: 20px !important;padding-top: 29px !important;background-color: #000000 !important;border-bottom-color: #000000 !important;border-bottom-style: solid !important;}"]column]column width="1/2" css=".vc_custom_1426138626593{border-top-width: 20px !important;border-right-width: 20px !important;border-bottom-width: 20px !important;border-left-width: 20px !important;border-left-color: #efefef !important;border-left-style: solid !important;border-right-color: #efefef !important;border-right-style: solid !important;border-top-color: #efefef !important;border-top-style: solid !important;border-bottom-color: #efefef !important;border-bottom-style: solid !important;}"]custom_heading text="Got Milk?" font_container="tag:h2|font_size:64px|text_align:center" google_fonts="font_family:Cinzel%3Aregular%2C700%2C900|font_style:400%20regular%3A400%3Anormal"]custom_heading text="0.03%" font_container="tag:h2|font_size:48px|text_align:center|color:%2381d742" google_fonts="font_family:Lato%3A100%2C100italic%2C300%2C300italic%2Cregular%2Citalic%2C700%2C700italic%2C900%2C900italic|font_style:900%20bold%20italic%3A900%3Aitalic" css=".vc_custom_1426570911484{margin-top: -6px !important;border-bottom-width: 70px !important;padding-top: -12px !important;border-bottom-color: #000000 !important;border-bottom-style: solid !important;}"]column]row]row]column]custom_heading text="Lots of Beer schools experience 200% more on-campus sexual assaults than Got Milk? schools" font_container="tag:h2|text_align:center|color:%23dd3333" google_fonts="font_family:Lato%3A100%2C100italic%2C300%2C300italic%2Cregular%2Citalic%2C700%2C700italic%2C900%2C900italic|font_style:900%20bold%20regular%3A900%3Anormal"]column_text css=".vc_custom_1426576901949{margin-top: -20px !important;}"]
column_text]column]row]row css=".vc_custom_1426577552737{margin-right: 10px !important;margin-left: 10px !important;padding-right: -5px !important;padding-left: -5px !important;background-color: #efefef !important;}"]column]separator color="chino" style="double"]custom_heading text="Startling Stats on College Sexual Assault" font_container="tag:h2|text_align:center" google_fonts="font_family:Cinzel%3Aregular%2C700%2C900|font_style:400%20regular%3A400%3Anormal"]column_text]
1
alleged forcible sex offense occurs on campus every
column_text]custom_heading text="2.5 hours" font_container="tag:h2|text_align:center|color:%231e1e1e" google_fonts="font_family:Cinzel%3Aregular%2C700%2C900|font_style:700%20bold%20regular%3A700%3Anormal"]column_text]
Which amounts to
column_text]custom_heading text="9.5 Daily" font_container="tag:h2|font_size:42px|text_align:center|color:%23dd3333" google_fonts="font_family:Cinzel%3Aregular%2C700%2C900|font_style:900%20bold%20regular%3A900%3Anormal"]custom_heading text="66.5 Weekly" font_container="tag:h2|font_size:42px|text_align:center|color:%23a82626" google_fonts="font_family:Cinzel%3Aregular%2C700%2C900|font_style:900%20bold%20regular%3A900%3Anormal"]custom_heading text="3,469 Yearly" font_container="tag:h2|font_size:44px|text_align:center|color:%23890000" google_fonts="font_family:Cinzel%3Aregular%2C700%2C900|font_style:900%20bold%20regular%3A900%3Anormal"]column_text css=".vc_custom_1426582061198{margin-top: -10px !important;margin-bottom: -10px !important;}"]
column_text]separator color="chino" style="double"]column]row]row]column]custom_heading text="Factors That Increase Sexual Assaults at Colleges" font_container="tag:h2|font_size:76px|text_align:center|line_height:1" google_fonts="font_family:Cinzel%3Aregular%2C700%2C900|font_style:700%20bold%20regular%3A700%3Anormal"]column]row]row]column css=".vc_custom_1426140909292{border-top-width: 20px !important;border-right-width: 20px !important;border-bottom-width: 20px !important;border-left-width: 20px !important;background-color: #000000 !important;border-left-color: #efefef !important;border-left-style: solid !important;border-right-color: #efefef !important;border-right-style: solid !important;border-top-color: #efefef !important;border-top-style: solid !important;border-bottom-color: #efefef !important;border-bottom-style: solid !important;}"]custom_heading text="Lots of Greek Life" font_container="tag:h2|font_size:64px|text_align:center|color:%23ffffff|line_height:1" google_fonts="font_family:Lato%3A100%2C100italic%2C300%2C300italic%2Cregular%2Citalic%2C700%2C700italic%2C900%2C900italic|font_style:400%20regular%3A400%3Anormal" css=".vc_custom_1426140883578{margin-right: 5px !important;margin-left: 5px !important;padding-right: 5px !important;padding-left: 5px !important;background-color: #000000 !important;}"]custom_heading text="0.15%" font_container="tag:h2|font_size:48px|text_align:center|color:%23dd3333" google_fonts="font_family:Lato%3A100%2C100italic%2C300%2C300italic%2Cregular%2Citalic%2C700%2C700italic%2C900%2C900italic|font_style:900%20bold%20italic%3A900%3Aitalic" css=".vc_custom_1426577732872{background-color: #000000 !important;}"]column_text css=".vc_custom_1426573462392{background-color: #eaeaea !important;}"]
Women in Sororities
74%
more likely
to experience rape than other college women
column_text]column]row]row css=".vc_custom_1426150096309{background-color: #f1f1d4 !important;}"]column]column_text]
"Fraternity men have a higher risk for committing sexual assault."
column_text]column]row]row css=".vc_custom_1426577118266{border-top-width: 20px !important;border-right-width: 20px !important;border-bottom-width: 20px !important;border-left-width: 20px !important;background-image: url(https://www.edsmart.org/wp-content/uploads/2015/03/college_rape_alcohol_statis.png?id=112) !important;background-position: center !important;background-repeat: no-repeat !important;background-size: cover !important;border-left-color: #fcfcfc !important;border-left-style: solid !important;border-right-color: #fcfcfc !important;border-right-style: solid !important;border-top-color: #fcfcfc !important;border-top-style: solid !important;border-bottom-color: #fcfcfc !important;border-bottom-style: solid !important;}"]column]custom_heading text="ALCOHOL USE" font_container="tag:h2|font_size:84px|text_align:center|color:%23001f5e" google_fonts="font_family:Permanent%20Marker%3Aregular|font_style:400%20regular%3A400%3Anormal" css=".vc_custom_1426147502613{margin-bottom: 10px !important;padding-top: 10px !important;background-position: center !important;background-repeat: no-repeat !important;background-size: cover !important;}"]column_text css=".vc_custom_1426143569149{background-position: center !important;background-repeat: no-repeat !important;background-size: contain !important;}"]
is most commonly associated with sexual assault on campus
column_text]column_text css=".vc_custom_1426573294609{margin-top: -20px !important;padding-bottom: 5px !important;}"]
75% of fraternity members engage in heavy drinking
versus 49% of their non-fraternity peers
62% of sorority members engage in heavy drinking
versus 41% of other non-sorority students
column_text]column]row]row css=".vc_custom_1426577062642{background-color: #ff0000 !important;border: 20px solid #fcfcfc !important;}"]column]column_text]
"Red Zone"
Rates of sexual assault reports involving freshman women are statistically higher in
October
column_text]column]row]row]column]custom_heading text="Other High Risk Factors According to Recent Government Study" font_container="tag:h2|text_align:center|color:%23303030" google_fonts="font_family:Cinzel%3Aregular%2C700%2C900|font_style:400%20regular%3A400%3Anormal"]column]row]row]column width="1/4"]column_text] column_text]column_text]
Numerous sexual partners
Women who report having more sexual partners since entering college are more likely to experience forced sexual assault.column_text]column]column width="1/4"]column_text] column_text]column_text]
Freshman or sophomore status
The initial couple of years in college present the greatest risk with the beginning months of the academic year being the most precarious period annually. column_text]column]column width="1/4"]column_text] column_text]column_text]
Day of the week
Over fifty percent of sexual assaults transpire during the weekend. The bulk of these occurrences typically unfold in the wee hours, particularly in the time span from midnight to 6 a.m. column_text]column]column width="1/4"]column_text] column_text]column_text]
Off-campus parties
Over fifty percent of sexual assault cases involving college women occur in locations outside the campus. Similarly a majority of women who reported experiencing sexual assault while incapacitated indicated the incident transpired during a party.column_text]column]row]row]column]column_text css=".vc_custom_1426576161207{margin-top: -10px !important;margin-bottom: -30px !important;}"]

![]()

column_text]column]row]row]column width="1/2"]column_text]
Physically forced sexual assault (no drugs or alcohol involved). Women on college campuses are more likely to be victims if they:
- Experienced physically forced sexual assault before entering college.
- Have experienced dating violence since entering college.
- Are Hispanic (compared to white non-Hispanics).
- Have had more dating partners since entering college.
column_text]column]column width="1/2"]column_text]Incapacitated sexual assault. For the survey, the researchers used a broad definition of “incapacitated” that included being drunk, under the influence of drugs, passed out, asleep or otherwise incapacitated. Women on campuses are more likely to be victims of incapacitated sexual assault if they:
- Experienced incapacitated sexual assault before entering college.
- Have experienced dating violence since entering college.
- Have ever been given a drug without their consent since entering college.
- Got drunk more often since entering college.
- Reported being often drunk or high during sex since entering college.
- Often attended fraternity parties.
column_text]column]row]row]column]column_text]column_text]custom_heading text="Data Sets" font_container="tag:h2|text_align:center" google_fonts="font_family:Cinzel%3Aregular%2C700%2C900|font_style:400%20regular%3A400%3Anormal"]accordion active_tab="false" collapsible="yes"]accordion_tab title="Party Schools vs Stone-Cold-Sober Schools"]row_inner]column_inner width="1/2"]column_text]
| Party School | Sex offenses - Forcible Incidents (2011-2013) | Student Population | Student Forcible Sex Offenses/Student Population |
| Syracuse University | 25 | 21,267 | 0.12% |
| University of Iowa | 34 | 29,748 | 0.11% |
| University of California Santa Barbara | 42 | 22,225 | 0.19% |
| West Virginia University | 16 | 29,466 | 0.05% |
| University of Illinois at Urbana - Champaign | 27 | 44,942 | 0.06% |
| Lehigh University | 10 | 7,096 | 0.14% |
| Pennsylvania State University - Main Campus - University Park | 97 | 46,615 | 0.21% |
| University of Wisconson - Madison (2010-2012) | N/A | 3,608 | N/A |
| Bucknell University | 30 | 3,608 | 0.83% |
| University of Florida | 35 | 49,878 | 0.07% |
| Average | 0.20% | ||
| Avg (2011-2013) | 0.07% |
column_text]column_inner]column_inner width="1/2"]column_text]
| Stone-Cold-Sober School | Sex offenses - Forcible Incidents (2011-2013) | Student Population | Student Forcible Sex Offenses/Student Population |
| Brigham Young University (UT) | 19 | 31,123 | 0.06% |
| Wheaton College (IL) | 2 | 2,993 | 0.07% |
| United States Military Academy | N/A | N/A | N/A |
| Calvin College | 2 | 4,034 | 0.05% |
| Thomas Aquinas College | 0 | 366 | 0.00% |
| College Of The Ozarks | 0 | 1,513 | 0.00% |
| Gordon College | 1 | 2,073 | 0.05% |
| Grove City College | N/A | N/A | |
| United States Coast Guard Academy | N/A | N/A | |
| CUNY Brooklyn College | 1 | 17,004 | 0.01% |
| Average | 0.03% | ||
| Avg (2011-2013) | 0.01% |
column_text]column_inner]row_inner]accordion_tab]accordion_tab title="Least Religious Schools vs Most Religious Schools"]row_inner]column_inner width="1/2"]column_text]
| Least Religious Students | Sex offenses - Forcible Incidents (2011-2013) | Student Population | Student Forcible Sex Offenses/Student Population |
| Vassar College | 47 | 2,477 | 1.90% |
| Lewis & Clark College | 15 | 3,521 | 0.43% |
| Pomona College | 14 | 1,610 | 0.87% |
| Reed College | 47 | 1,411 | 3.33% |
| Bard College | 26 | 2,355 | 1.10% |
| Bennington College | 3 | 738 | 0.41% |
| Sarah Lawrence College | 12 | 1,782 | 0.67% |
| Skidmore College | 22 | 2,702 | 0.81% |
| Emerson College | 14 | 4,561 | 0.31% |
| Bard College at Simon's Rock | 2 | 350 | 0.57% |
| Average | 1.04% | ||
| Avg (2011-2013) | 0.35% |
column_text]column_inner]column_inner width="1/2"]column_text]
| Most Religious Students | Sex offenses - Forcible Incidents (2011-2013) | Student Population | Student Forcible Sex Offenses/Student Population |
| Brigham Young University (UT) | 19 | 31,123 | 0.06% |
| Thomas Aquinas College | 0 | 366 | 0.00% |
| Wheaton College (IL) | 2 | 2,993 | 0.07% |
| Hillsdale College | 0 | 35 | 0.00% |
| Gordon College | 1 | 2,073 | 0.05% |
| Grove City College | N/A | N/A | |
| University of Dallas | 2 | 2,598 | 0.08% |
| College Of The Ozarks | 0 | 1,513 | 0.00% |
| Texas A&M University--College Station | 18 | 55,697 | 0.03% |
| Calvin College | 2 | 4,034 | 0.05% |
| Average | 0.04% | ||
| Avg (2011-2013) | 0.01% |
column_text]column_inner]row_inner]accordion_tab]accordion_tab title="Most Liberal Students Schools vs Most Conservative Students"]row_inner]column_inner width="1/2"]column_text]
| Most Liberal Students | Sex offenses - Forcible Incidents (2011-2013) | Student Population | Student Forcibile Sex Offenses/Student Population |
| Sarah Lawrence College | 12 | 1,782 | 0.67% |
| Warren Wilson College | 15 | 893 | 1.68% |
| Bennington College | 3 | 738 | 0.41% |
| Bard College | 26 | 2,355 | 1.10% |
| Marlboro College | 7 | 260 | 2.69% |
| College of the Atlantic | 0 | 370 | 0.00% |
| Beloit College | 11 | 1,306 | 0.84% |
| Reed College | 47 | 1,411 | 3.33% |
| New College of Florida | 3 | 793 | 0.38% |
| Smith College | 10 | 3,033 | 0.33% |
| Average | 1.14% | ||
| Avg (2011-2013) | 0.38% |
column_text]column_inner]column_inner width="1/2"]column_text]
| Most Conservative Students | Sex offenses - Forcible Incidents (2011-2013) | Student Population | Student Forcibile Sex Offenses/Student Population |
| Texas A&M University--College Station | 18 | 55,697 | 0.03% |
| Thomas Aquinas College | 0 | 366 | 0.00% |
| Grove City College | N/A | N/A | |
| College Of The Ozarks | 0 | 1,513 | 0.00% |
| University of Dallas | 2 | 2,598 | 0.08% |
| United States Merchant Marine Academy | 0 | 985 | 0.00% |
| Auburn University | 8 | 24,864 | 0.03% |
| Hampden-Sydney College | 3 | 1,070 | 0.28% |
| Brigham Young University (UT) | 19 | 31,123 | 0.06% |
| Hillsdale College | 0 | 35 | 0.00% |
| Average | 0.05% | ||
| Avg (2011-2013) | 0.02% |
column_text]column_inner]row_inner]accordion_tab]accordion_tab title="Lots of Hard Liquor vs Scotch and Soda, Hold the Scotch"]row_inner]column_inner width="1/2"]column_text]
| Lots of Hard Liquor | Sex offenses - Forcible Incidents (2011-2013) | Student Population | Student Forcibile Sex Offenses/Student Population |
| University of Iowa | 34 | 29,748 | 0.11% |
| Syracuse University | 25 | 21,267 | 0.12% |
| Providence College | 7 | 4,665 | 0.15% |
| Tulane University | 14 | 12,938 | 0.11% |
| University of Georgia | 27 | 34,536 | 0.08% |
| University of California Santa Barbara | 42 | 22,225 | 0.19% |
| Connecticut College | 25 | 1,922 | 1.30% |
| Colgate University | 11 | 2,900 | 0.38% |
| Wake Forest University | 11 | 7,602 | 0.14% |
| University of Wisconsin - Madison (2010-2012) | N/A | 3,608 | N/A |
| Average | 0.29% | ||
| Avg (2011-2013) | 0.10% |
column_text]column_inner]column_inner width="1/2"]column_text]
| Scotch and Soda, Hold the Scotch | Sex offenses - Forcible Incidents (2011-2013) | Student Population | Student Forcibile Sex Offenses/Student Population |
| Brigham Young University (UT) | 19 | 31,123 | 0.06% |
| College Of The Ozarks | 0 | 1,513 | 0.00% |
| Wheaton College (IL) | 2 | 2,993 | 0.07% |
| Grove City College | N/A | N/A | |
| Gordon College | 1 | 2,073 | 0.05% |
| Cuny Brooklyn College | 1 | 17,004 | 0.01% |
| Wesleyan College (GA) | 2 | 700 | 0.29% |
| CUNY--Queens College | 4 | 18,974 | 0.02% |
| CUNY--City College | 36 | 26,957 | 0.13% |
| Christopher Newport University | 10 | 5,232 | 0.19% |
| Average | 0.09% | ||
| Avg (2011-2013) | 0.03% |
column_text]column_inner]row_inner]accordion_tab]accordion_tab title="Lots of Beer vs Got Milk?"]row_inner]column_inner width="1/2"]column_text]
| Lots of Beer | Sex offenses - Forcible Incidents (2011-2013) | Student Population | Student Forcibile Sex Offenses/Student Population |
| Pennsylvania State University - Main Campus - University Park | 97 | 46,615 | 0.21% |
| University of Florida | 35 | 49,878 | 0.07% |
| Florida State University | 16 | 40,909 | 0.04% |
| Syracuse University | 25 | 21,267 | 0.12% |
| University of Wisconsin - Madison (2010-2012) | N/A | 3,608 | N/A |
| Ohio University--Athens | N/A | N/A | |
| Lehigh University | 10 | 7,096 | 0.14% |
| University of Illinois at Urbana - Champaign | 27 | 44,942 | 0.06% |
| University of Iowa | 34 | 29,748 | 0.11% |
| Bucknell University | 30 | 3,608 | 0.83% |
| Average | 0.18% | ||
| Avg (2011-2013) | 0.06% |
column_text]column_inner]column_inner width="1/2"]column_text]
| Got Milk? | Sex offenses - Forcible Incidents (2011-2013) | Student Population | Student Forcibile Sex Offenses/Student Population |
| Brigham Young University (UT) | 19 | 31,123 | 0.06% |
| Cuny Brooklyn College | 1 | 17,004 | 0.01% |
| College Of The Ozarks | 0 | 1,513 | 0.00% |
| Wheaton College (IL) | 2 | 2,993 | 0.07% |
| Gordon College | 1 | 2,073 | 0.05% |
| Wesleyan College (GA) | 2 | 700 | 0.29% |
| Grove City College | N/A | N/A | |
| Spelman College | 0 | 2,129 | 0.00% |
| Xavier University of Louisiana | 3 | 3,121 | 0.10% |
| City University of New York--City College | 36 | 26,957 | 0.13% |
| Average | 0.08% | ||
| Avg (2011-2013) | 0.03% |
column_text]column_text css=".vc_custom_1426576745720{margin-top: -20px !important;}"]
column_text]column_inner]row_inner]accordion_tab]accordion_tab title="Lots of Greek Life"]row_inner]column_inner width="1/2"]column_text]
| Lots of Greek Life | Sex offenses - Forcible Incidents (2011-2013) | Student Population | Student Forcibile Sex Offenses/Student Population |
| Transylvania University | 5 | 1,082 | 0.46% |
| Gettysburg College | 16 | 2,524 | 0.63% |
| Southern Methodist University | 12 | 10,929 | 0.11% |
| Depauw University | 25 | 2,304 | 1.09% |
| Dartmouth College | 49 | 6,342 | 0.77% |
| Miami University (OH) | 39 | 17,901 | 0.22% |
| Bucknell University | 30 | 3,608 | 0.83% |
| Syracuse University | 25 | 21,267 | 0.12% |
| University of Illinois at Urbana - Champaign | 27 | 44,942 | 0.06% |
| Lehigh University | 10 | 7,096 | 0.14% |
| Average | 0.44% | ||
| Avg (2011-2013) | 0.15% |
column_text]column_inner]row_inner]accordion_tab]accordion]column]row]row]column]column_text]Sources:
http://www.princetonreview.com/college-rankings.aspx
http://nces.ed.gov/collegenavigator
http://inewsource.org/2014/10/21/fraternity-culture-linked-to-college-sexual-assault-problem/
http://www.nij.gov/topics/crime/rape-sexual-violence/campus/pages/increased-risk.aspx
http://www.jstor.org/discover/10.2307/189830?uid=3739560&uid=2&uid=4&uid=3739256&sid=21105620032911
http://www.ncjrs.gov/pdffiles1/nij/grants/221153.pdf
http://apps.washingtonpost.com/g/page/local/sex-offenses-on-us-college-campuses/1077/
http://www.skillsyouneed.com/num/percent-change.html
http://onlinelibrary.wiley.com/doi/10.1002/aehe.20012/abstractcolumn_text]column]row]