AI headlines are changing how families think about college majors. We wanted to know whether the outcome data agreed.
Survey fears are not educational outcomes.
Key Takeaways
- Computer science had the highest AI exposure in this analysis but not the weakest financial outcomes.
- Business AI use and college-educated workforce share look out of sync in some states—a broad signal, not a major-specific forecast.
- Compare program-level pay, debt, completion, and local placement—not AI headlines alone.
Should AI fears change which college major you choose?
“Headlines move faster than outcome data.”
College counselors we spoke with say the same thing families hear in advising offices: do not let a news cycle pick the major.
“I advise families not to let fear-driven AI headlines dictate a student’s major choice. Instead, they should consider the full picture when exploring options. A student’s strengths, interests, and goals should remain at the center, while also weighing program outcomes, affordability, career paths, and transferable skills.”
— Ann LaFemina, Educational Consultant, Winter Park College Consultants, Orlando, Florida
What we found
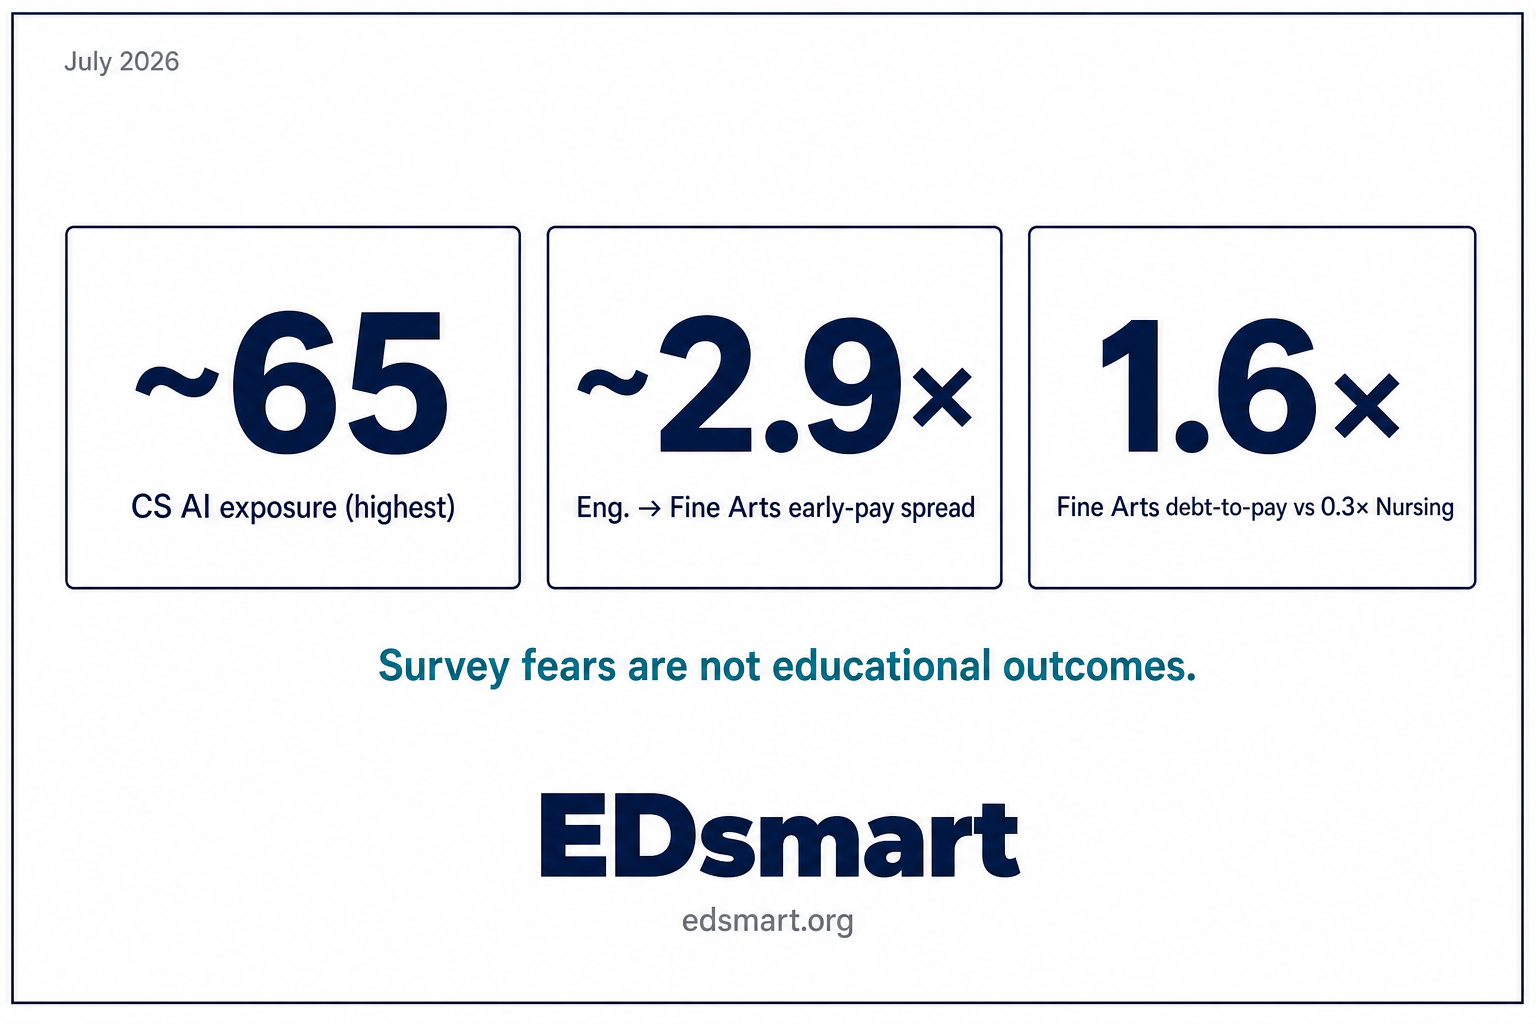
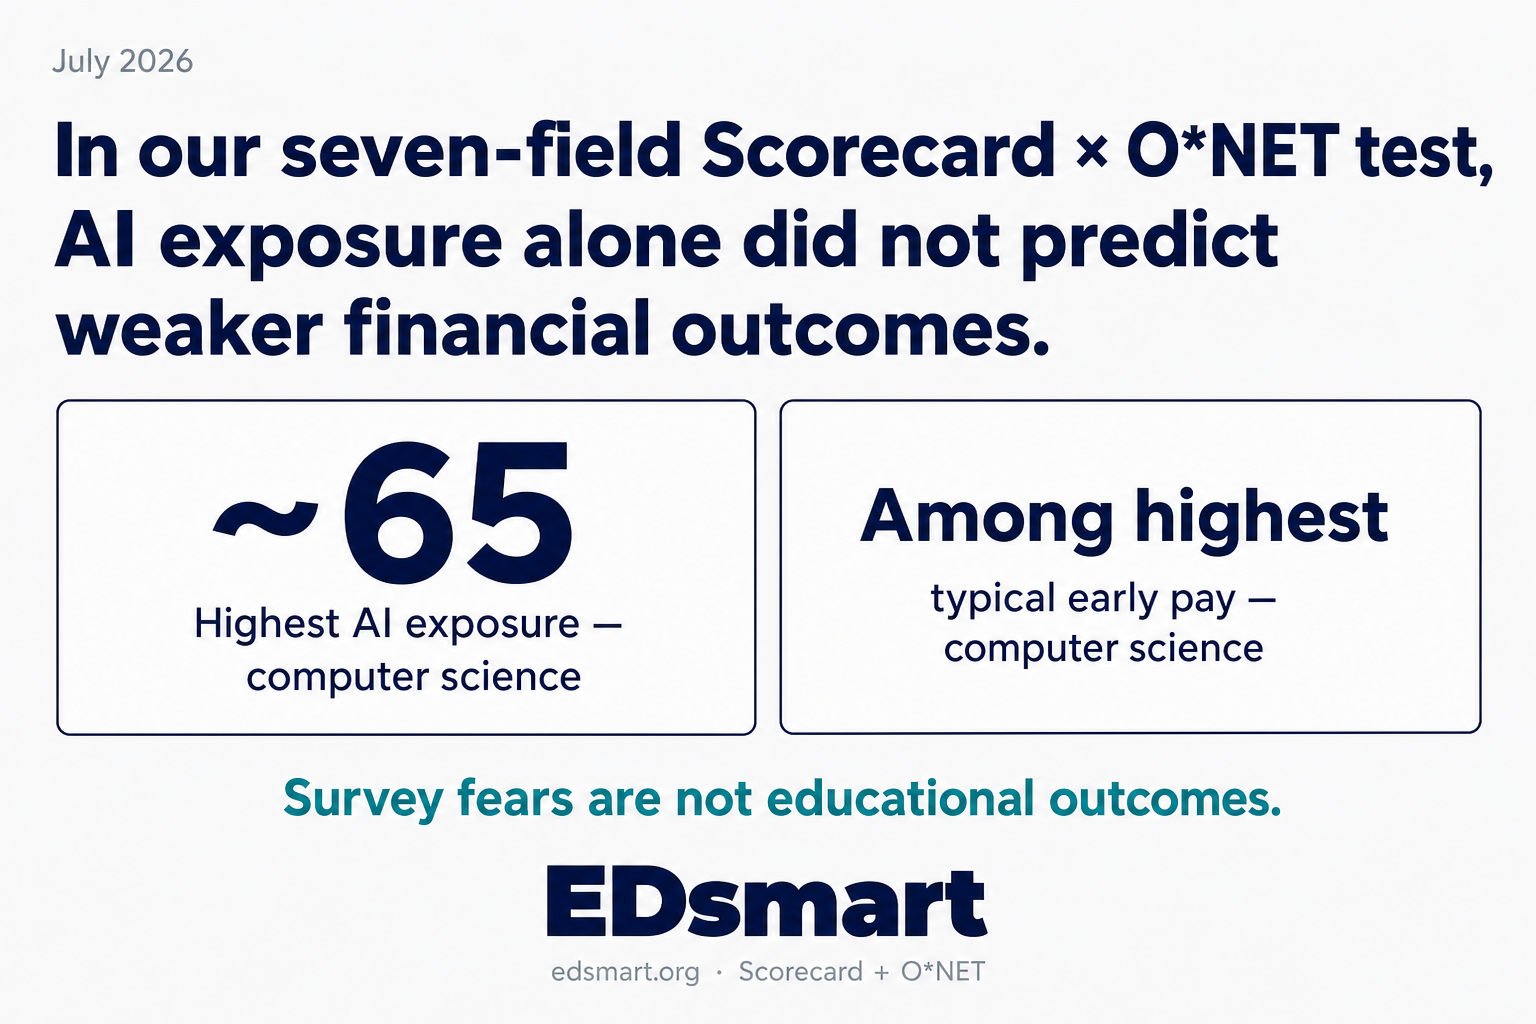
- Exposure vs. pay: In our seven-family analysis, computer science had the highest AI exposure score (about 65) but not the weakest financial outcomes—it ranks among the highest for typical first-year pay.
- Pay and debt: Our analysis of College Scorecard data shows typical first-year pay spreads about 2.9× across those families (Engineering to Fine Arts). Debt-to-pay runs about 1.6× in Fine Arts vs. 0.3× in Nursing.
- Where you work: Business AI use and the share of college-educated adults look out of sync in some states. West Virginia ranks highest and District of Columbia lowest on our gap score.
Start here: Run the program checklist on your shortlist before you commit.
How we investigated
College is one of the biggest financial decisions many families make. AI headlines can shape those decisions. We tested the broader AI narrative against federal earnings, debt, and labor-market data.
AI exposure
Program payoff
Compare pay · debt · completion · local placement
Program-level decisions
The biggest surprise
If AI exposure were a reliable sign of weak financial outcomes, we would expect highly exposed fields to perform worse. We chose computer science as our editorial stress test—it sits at the center of today's AI conversation. In this seven-family comparison, computer science did not fit that pattern.
Computer science had the highest AI exposure in our comparison and still ranked among the highest for typical first-year pay. National enrollment in computer and information sciences (CIP 11.07) fell about 12.5% from spring 2025 to spring 2026 (217,482 to 190,285 students), even as earnings for the field remained strong in federal data.
Our analysis doesn't suggest AI exposure is unimportant. It suggests AI exposure alone didn't predict weaker financial outcomes in our seven-family comparison. Families should evaluate pay, debt, completion, and local labor markets—not AI exposure by itself.
That finding lines up with how academic advisors frame the decision: the better question is whether a program prepares you to work with AI—not whether to abandon a field because headlines say it is “exposed.”
“It’s not about changing what to major in but rather closely researching if curricular and co-curricular opportunities will prepare you for an AI-driven world. Do courses highlight applications of AI skills and tools in your field? Are ethical issues covered? Will you be doing group work projects and applied/practicum components? … It’s about getting a handle on how AI is used in your field while building up those irreplaceably human qualities, perspectives, and skills.”
— Indhika Jayaratnam, Academic Advisor and Graduate School Admissions Counselor, IvyWise, Incheon, South Korea
Pay and debt do not track exposure alone
If AI exposure alone determined outcomes, we'd expect the highest-exposure fields to have the weakest financial outcomes. That's not what we found. Our analysis of College Scorecard data shows a more complicated pattern.
Pay, debt, and exposure by major family
| Field family | AI exposure | Debt ÷ typical pay | Not working after 1 year |
|---|---|---|---|
| Engineering | 39.2 | 0.53× | 3.0% |
| Computer Science | 65.2 | 0.40× | 5.6% |
| Nursing | 34.3 | 0.29× | 25.9% |
| Business | 32.9 | 0.55× | 3.7% |
| Education | 21.1 | 0.63× | 3.2% |
| Liberal Arts | 59.3 | 0.76× | 5.9% |
| Fine Arts | 47.7 | 1.62× | 5.5% |
Seven major families in our Scorecard pull. AI exposure: O*NET-based AI task-exposure index (0–100). Typical first-year pay (not shown in this table) runs about 2.9× from Engineering to Fine Arts in the same extract. “Not working after 1 year” is the Scorecard outcome measure for graduates not in the observed workforce one year out—it is not the same as a conventional unemployment rate. Nursing’s higher figure may reflect licensure, clinical training, or field-specific work patterns rather than weak demand.
Local context: where you begin your career matters too
Choosing a major is not the only decision. Where you plan to work can shape the labor market you enter.
We compared business AI adoption with bachelor's attainment among adults age 25+ in each state. We use the gap as a broad signal of whether a state's college-educated workforce and employer AI adoption appear to be moving together. It does not measure demand for any particular major.
| State | Gap score | Business AI use | BA+ share (25+) |
|---|---|---|---|
| West Virginia | 100.0 | 10.8% | 24.0% |
| Arkansas | 91.3 | 12.1% | 26.2% |
| North Dakota | 90.7 | 13.4% | 33.6% |
| Mississippi | 88.5 | 13.1% | 25.5% |
| Alaska | 85.1 | 12.7% | 32.2% |
| State | Gap score | Business AI use | BA+ share (25+) |
|---|---|---|---|
| Arizona | 34.2 | 23.0% | 33.5% |
| Colorado | 19.3 | 23.0% | 46.4% |
| District of Columbia | 0.0 | 22.9% | 65.9% |
Exposure, pay, debt, and local jobs data do not always move together. AI headlines rarely capture that nuance.
Before you enroll
Run these five checks on every program on your shortlist.
- Typical pay one year out for that major at each school.
- Median debt ÷ typical pay—can you manage loans on typical earnings?
- Completion rate for that program—not just enrollment counts.
- Campus AI use policy—how the school handles AI in class, tests, and integrity rules.
- Internships and placement in your local market—ask for real numbers.
Hiring managers who screen new graduates describe the same checks—and they do not tell families to drop a major because of this week’s AI headline.
“As a hiring manager, I would not tell families to steer away from a major just because AI headlines are scary. I would look at program cost, debt, completion rate, internships, local job placement, and whether the school is teaching students how to use AI responsibly inside the field. The strongest early-career candidates are not the ones who ignore AI or fear it. They are the ones who combine their major with communication skills, problem-solving, and good judgment around when AI should and should not be used.”
— Eric Turney, Owner and Sales and Marketing Director, The Monterey Company, Bend, Oregon
The answer
Our analysis suggests that AI headlines alone are not a reliable basis for choosing—or avoiding—a college major.
Survey fears are not educational outcomes. AI exposure can coexist with strong early earnings, as computer science shows in this field-family comparison.
Families should compare program-level pay, debt, completion, and local placement before making a decision.
Key takeaways
- Computer science had the highest AI exposure in this analysis and still ranked among the highest for typical first-year pay.
- Compare program-level pay, debt, completion, and local placement on your shortlist—not AI headlines alone.
How we built this report
We tested whether AI headlines match college outcomes using federal data from EDsmartData.com. See sources for the full list.
A few numbers explained
Debt-to-pay ratio. Imagine graduating with $40,000 in loans and entering a field where typical first-year pay is $40,000. That is roughly a 1.0× debt-to-pay ratio. Fine Arts families in our pull sit near 1.6×; Nursing near 0.3×.
AI exposure score. We use an O*NET-based AI task-exposure index (0–100) for how much current AI tools overlap with typical tasks in a field. It is not a job-loss forecast. Computer science scores about 65—the highest in this comparison.
Graduate AI economy gap. We compare business AI adoption with the share of adults holding bachelor's degrees in each state. Where those trends look far out of sync, we score a higher gap. The score is a broad labor-market signal—not demand for any one major.
This report is education planning context—not hiring, legal, or immigration advice.
Pearson/AWS survey figures come from 2,711 respondents across 6 countries; we cite them but did not run the survey. Debt-to-pay and AI exposure scores are proxies, not measures of AI skill or job loss.
Sources & methodology
We merged College Scorecard program-family medians, O*NET 28.0 Technology Skills exposure indexes, Census BTOS business AI use, ACS bachelor's attainment by state, National Student Clearinghouse CIP enrollment appendix figures, and BLS OEWS wage medians via EDsmartData.com. Pearson/AWS survey figures are third-party benchmarks we cite for context—not outcomes we measured.
- Pearson and Amazon Web Services, AI Readiness: Building the Bridge from Higher Education to Work (2026), U.S. country report.
- EDsmartData.com — Scorecard medians, O*NET indexes, and debt-to-earnings tables (July 2026 pull).
- College Scorecard field-of-study outcomes.
- O*NET Center, O*NET 28.0 Technology Skills — AI task-exposure index by field (formal source label).
- U.S. Census Bureau, Business Trends and Outlook Survey (BTOS) — state business AI use.
- U.S. Census Bureau, American Community Survey — bachelor's degree share (age 25+).
- National Student Clearinghouse Research Center — CIP 11.07 spring enrollment appendix.
- BLS May 2024 OEWS — STEM vs. non-STEM wage medians.
- EDsmart.org: AI, Skills, and the New Premium; The College ROI Divide; Debt and Completion.
Related reading
More context on program pay, debt, and AI: The College ROI Divide, AI, Skills, and the New Premium, and Debt and Completion. Data tables: AI exposure by major and debt-to-earnings by major on EDsmartData.com.