Women earn most degrees—but not always in the highest-paying majors. Two gaps: who finishes college vs. what those majors typically pay.
Women earn most college degrees—but often in majors with lower typical early pay. We matched who graduates in each field to what those programs usually pay.
Key Takeaways
- Women lead on degree counts nationally; men and women still cluster in different top majors.
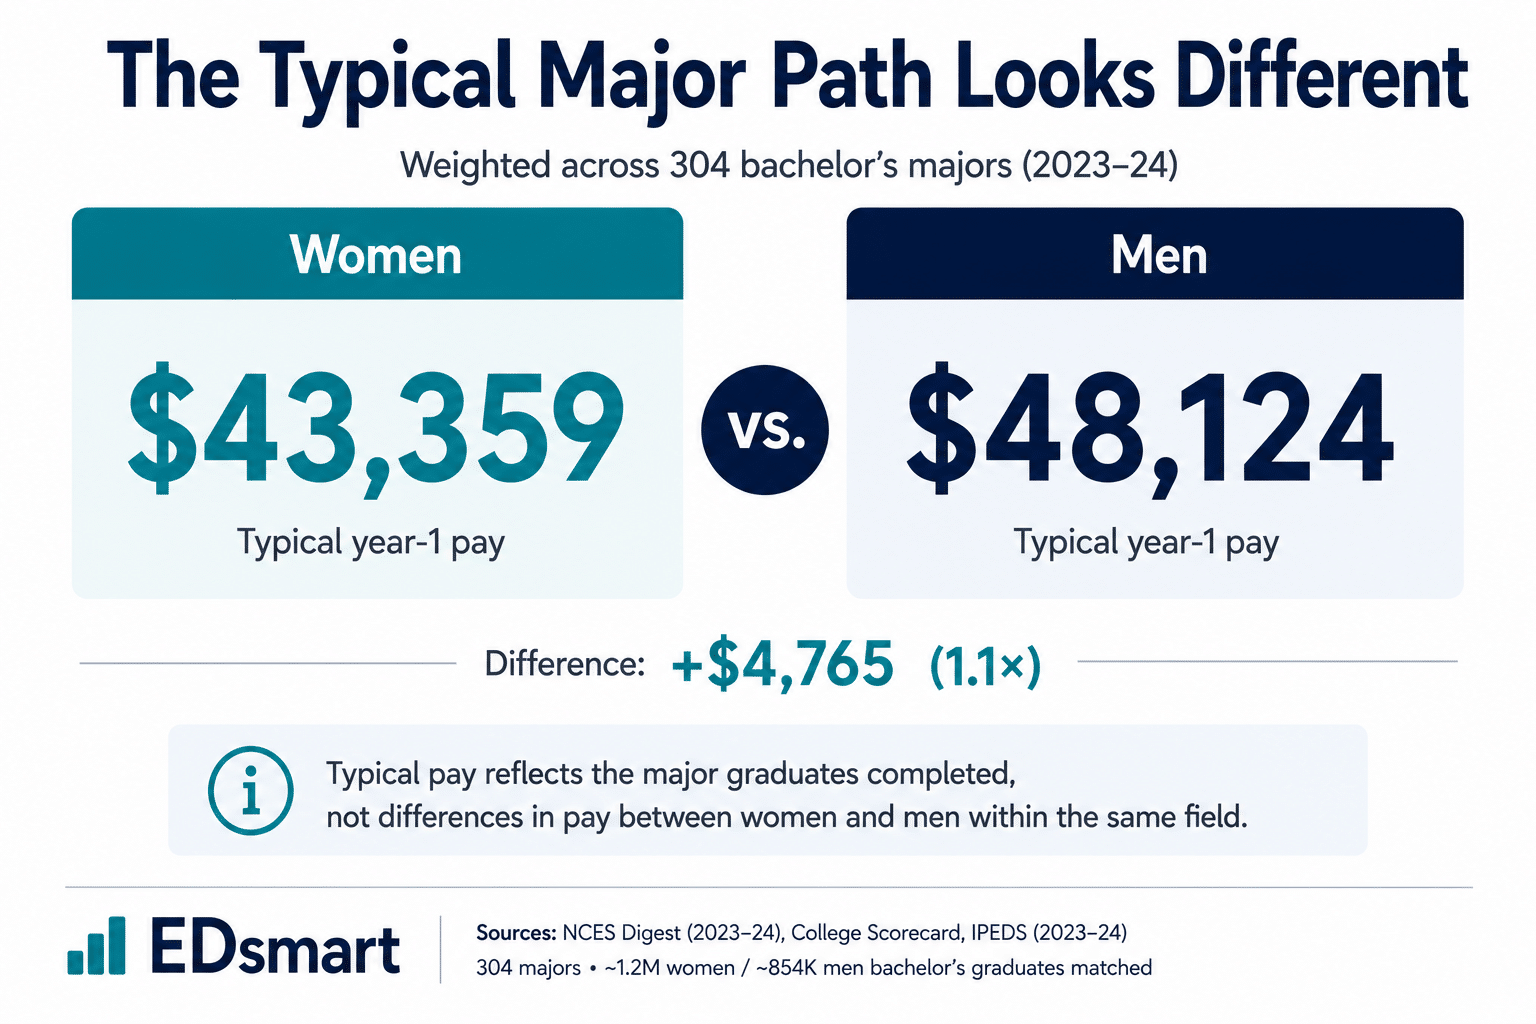
- Weighted across 304 majors, the typical pathway women complete pays about $4,765 less in year-1 typical pay than men’s.
- Female-skewed headline majors cluster lower than male-skewed STEM fields in typical pay—nursing is the main exception.
- Earning more degrees has not, by itself, closed the worker-level earnings gap between women and men.
Women earn most college degrees—but often in majors that pay less. About 59.6% of bachelor’s degrees go to women (NCES Digest Table 318.10). Pew Research Center finds about 47% of women ages 25–34 hold a bachelor’s vs. 37% of men. The twist: the majors women finish most often are not the highest-paying ones. In eight common majors, female-skewed fields average about $43,667 in typical first-year pay vs. $71,082 for male-skewed STEM fields (1.6×, unweighted). Nursing is the exception at $75,087. Even among bachelor’s holders, women still earn about $23,600 less per year on average than men (Education Pays).
Headlines about “more women than men in college” tell only half the story. Finishing a degree and finishing a degree that typically pays well are different outcomes—and which major you choose is where those stories meet.
We matched federal graduation counts (who finished each major in 2023–24) to public data on typical pay and debt for those programs—linking who graduates with what those majors usually pay. That extends Issue 1’s program-level ROI frame: judge the program, not just enrollment headlines. If debt or dropping out is the bigger risk, continue with Issue 2 on credential failure.
When we say typical pay, we mean the national middle: half of graduates from that major earn more, half earn less, about one year after finishing. It is not a guarantee about your job offer. Graduation counts describe who finished; pay figures describe the major, not men vs. women in the same major.
What this means for you
You do not need a background in higher education to follow this report. Here is the story in everyday terms:
- Women are ahead on degrees. About 59.6% of bachelor’s degrees go to women (NCES Digest, Table 318.10). In spring 2024, about 57.6% of undergraduates in class were women (Clearinghouse estimates).
- But not all majors pay the same. We matched who graduated in each major to what those programs typically pay one year out (304 majors with public data). Weighted by actual graduates, women’s typical path averaged about $43,359 vs. $48,124 for men (1.1×). That reflects different major choices—not two people in the same job being paid differently because of sex.
- Many women graduate from lower-paying fields. About 57.5% of women who earned a bachelor’s in a major we could match to pay data finished in a field whose typical first-year pay was below the national median for majors ($40,786). About 67.7% finished in a major with typical pay under $45,000 a year out.
- Nursing is the standout. It is the #1 major for women and pays about $75,087 in typical first-year pay—well above psychology, teaching, or social work.
- A degree has not closed the paycheck gap. Among workers who hold a bachelor’s, women still earn about $23,600 less per year on average than men (Education Pays). Major choice explains part of that gap; hours worked, occupation, and discrimination still matter too.
Words we use
Major (field of study): What you specialize in at college—nursing, psychology, computer science, and so on. Federal data uses numbered codes; we call them majors here.
Completer: Someone who finished and received a degree, not just someone who enrolled.
Typical pay (year 1): About half of graduates from that major earn more than this amount one year after finishing, and half earn less. It is a national middle-of-the-road figure, not a promise about your job offer.
Credential gap: Women earn more college degrees than men nationally.
Payoff gap: The majors women finish most often tend to pay less in typical early-career earnings than the majors men finish most often.
IPEDS: The federal system that counts who graduates from each college and major.
College Scorecard: A public U.S. Department of Education site that reports typical pay and debt by college program.
National Student Clearinghouse: A nonprofit that estimates how many students are enrolled each term—who is in class now, not only who already graduated.
Two gaps, one decision
Keep two ideas in mind as you read:
- The credential gap — Women earn more college degrees than men nationally. See degree counts.
- The payoff gap — The majors women finish most often tend to have lower typical first-year pay than the majors men finish most often. See pay by major.
Winning on degrees does not automatically mean winning on pay when men and women still cluster in different majors. Nursing is the main high-pay exception among female-skewed fields in our sample.
Credential Gap
Payoff Gap
Two Gaps Framework
Program choice
Sergio Pantoja Torres, a college counsellor at Education World Wide with more than 15 years advising students across the United States, China, and Europe, draws the same line for families weighing enrollment headlines against earnings:
“The degree gap and the pay gap are connected, but they are two different problems.”
— Sergio Pantoja Torres, college counsellor, Education World Wide
His practical takeaway matches this report: judge colleges on program-level earnings, completion costs, and local job demand—not graduation rates alone. “Check the labor market first, then choose a major,” he says.
If you only read three things
- Women lead on degrees. About 59.6% of bachelor’s degrees go to women—not only in nursing or teaching.
- Men and women often pick different majors. Nursing is #1 for women and #10 for men among top bachelor’s fields. Computer science is #2 for men and outside the women’s top 10.
- More degrees have not erased the pay gap. Women with a bachelor’s still earn about $23,600 less per year on average than men with a bachelor’s (Education Pays). Which major you choose is one reason—not the only one.
Start here: Two ideas drive this report. The credential gap is simple: women earn more college degrees than men. The payoff gap is the twist: the majors women finish most often tend to pay less in typical early-career earnings than the majors men finish most often. Both are true at the same time.
“Women earn most degrees—but not always in the highest-paying majors.”
Who finishes college and what those majors typically pay are related questions—but not the same one.
How to use this article
What it’s for: A plain-language look at why “women earn more degrees” does not automatically mean “women earn more after college”—with real numbers on majors and typical pay.
- What this means for you → Big picture
- Words we use → Plain language
- Two gaps framework → Two gaps
- Credential gap → Credential gap
- Major gap → Major gap
- Payoff gap → Payoff gap
- Checklist → Checklist
- Sources → Sources
How we built this report
We combined three public data streams that are usually read separately: federal counts of who graduated from each major (IPEDS 2023–24), typical pay and debt by program (College Scorecard), and national earnings trends (Census). Typical pay means the national middle one year after graduation—not your personal job offer. Graduation counts describe who finished; pay describes the major.
Enrollment counts from the National Student Clearinghouse are national estimates based on participating colleges, not a census of every student. In fall 2024, Clearinghouse data covered about 97.5% of federally aided colleges nationally (99.8% at public schools vs. 73.4% at for-profit schools). The Clearinghouse also tracks special institution groups (HBCUs, Hispanic-serving colleges, and others)—useful for sector dashboards, but not for sex-by-major tables in this report.
The credential gap: women lead on degrees
Federal degree counts show women earning a majority of associate’s, bachelor’s, master’s, and doctor’s degrees nationally. NCES Digest, Table 318.10 reports that in 2023–24 women received about 59.6% of bachelor’s degrees, 63.3% of master’s degrees, and 58.2% of doctor’s and first-professional degrees.
Georgetown CEW finds a similar pattern among adults ages 25–64: in 2020 about 48.9% of women and 41.3% of men held at least an associate’s degree (7.6 percentage points). At the bachelor’s level, 23.8% of women vs. 21.2% of men listed a bachelor’s as their highest degree (2.6 points).
Completion among young adults shows the same direction. Education Pays 2026 cites NCES Digest Table 104.20 for 2024: about 45% of women and 35% of men ages 25–29 held a bachelor’s degree. Pew Research Center puts the gap among ages 25–34 at 10 percentage points (47% vs. 37%).
Immediate college-going after high school is also uneven. Education Pays puts 2022 enrollment within a year of high school at about 57% for recent male graduates vs. 67% for female graduates (Figure 1.2A).
National Student Clearinghouse enrollment reports show the same direction among undergraduates currently in class. In spring 2024, women were about 57.6% of undergraduate enrollments across all sectors (8,020,948 women vs. 5,893,225 men). At public four-year colleges, women were about 55.9% of spring undergraduate enrollment. That lines up with Digest graduation shares (59.6% female among bachelor’s degrees in 2023–24), but the two measures answer different questions: who finished vs. who was enrolled that term.
| Term | Men | Women | Women’s share |
|---|---|---|---|
| Spring 2011 | 8,383,690 | 11,227,137 | 57.2% |
| Spring 2012 | 8,334,338 | 11,216,053 | 57.4% |
| Spring 2013 | 8,195,317 | 10,910,335 | 57.1% |
| Spring 2014 | 8,153,001 | 10,795,520 | 57.0% |
| Spring 2015 | 7,981,219 | 10,611,385 | 57.1% |
| Spring 2016 | 7,881,732 | 10,461,923 | 57.0% |
| Spring 2017 | 7,718,682 | 10,352,322 | 57.3% |
| Spring 2018 | 7,573,875 | 10,265,455 | 57.5% |
| Spring 2019 | 6,422,112 | 8,539,580 | 57.1% |
| Spring 2020 | 6,311,733 | 8,516,973 | 57.4% |
| Spring 2021 | 5,877,647 | 8,335,354 | 58.6% |
| Spring 2022 | 5,723,271 | 7,952,390 | 58.1% |
| Spring 2023 | 5,770,238 | 7,887,336 | 57.8% |
| Spring 2024 | 5,893,225 | 8,020,948 | 57.6% |
Fall-term Clearinghouse estimates show the same pattern: women were about 57.6% of undergraduate enrollments in fall 2023 (2010–2023 series). Spring 2024 and fall 2018–2023 gender counts come from downloadable appendix spreadsheets. Spring 2025 gender is on an interactive dashboard only. Clearinghouse enrollment files by major do not break out sex.
The major gap: different top-10 lists for men and women
Federal graduation counts for 2023–24 show how differently men and women cluster by major. We publish the full breakdown on EDsmartData.com.

Top bachelor’s majors — men
| Rank | Major | Male graduates |
|---|---|---|
| 1 | Business Administration and Management, General | 86,185 |
| 2 | Computer Science | 36,164 |
| 3 | Computer and Information Sciences and Support Services | 35,305 |
| 4 | Finance, General | 34,286 |
| 5 | Mechanical Engineering | 27,575 |
| 6 | General Biological Sciences | 26,197 |
| 7 | Sport and Fitness Administration/Management | 25,202 |
| 8 | General Psychology | 22,953 |
| 9 | General Economics | 22,564 |
| 10 | Registered Nursing, Nursing Administration, & Nursing Research | 20,543 |
Top bachelor’s majors — women
| Rank | Major | Female graduates |
|---|---|---|
| 1 | Registered Nursing, Nursing Administration, & Nursing Research | 132,797 |
| 2 | General Psychology | 95,974 |
| 3 | Business Administration and Management, General | 74,219 |
| 4 | General Biological Sciences | 56,848 |
| 5 | Elementary Education & Teaching | 46,628 |
| 6 | Communication and Media Studies | 27,700 |
| 7 | Criminal Justice - Law Enforcement Administration | 27,277 |
| 8 | Marketing/Marketing Management, General | 25,674 |
| 9 | Liberal Arts & Sciences | 24,580 |
| 10 | Sport and Fitness Administration/Management | 23,215 |
Business administration appears near the top for both sexes, but the rest of the lists diverge. Registered nursing is the largest major for women (132,797 female graduates) and ranks tenth for men (20,543 male graduates). That major is 86.6% female overall. Computer science is second for men and outside the women’s top 10; that major is 78.3% male among bachelor’s graduates.
Those lists are not random sorting. Lidija Elezovic, a psychologist and school counselor at Education World Wide, says major choice often hardens before students ever see a pay chart:
“Most major decisions are made based on psychological factors long before they can be made based on salary.”
— Lidija Elezovic, psychologist and school counselor, Education World Wide
She also sees how quickly exposure can rewrite the map: students who ruled out engineering, finance, or tech often reconsider after meeting one woman in the field—and students who never pictured medicine sometimes change course after shadowing a physician. That fits the pattern in our top-10 tables: women dominate nursing and psychology completions, while computer science remains male-skewed, even though women earn most bachelor’s degrees overall.
E. Michele Ramsey, Ph.D., a professor of Communication Arts and Sciences and Women’s, Gender, and Sexuality Studies at Penn State Berks and co-author of Major Decisions, argues that both halves of this report—women’s lead on degrees and clustering into lower-paying majors—often trace to the same root: gender role expectations. That shows up early in how schools steer students:
“When K-12 education is gendered, generally speaking, college major choice is likely to be gendered as well. Boys are encouraged into “hard” subjects while girls are encouraged toward “soft” subjects. And historically, those “soft” subjects have paid less than others.”
— E. Michele Ramsey, Ph.D.
That pathway helps explain why our top-10 lists diverge even while women earn most bachelor’s degrees overall. She also urges families to weigh workforce analysis and salary data themselves rather than treating STEM-or-bust headlines as the only path to a good career—an emphasis that matches this report’s checklist: judge the program and the local labor market, not enrollment headlines alone.
Enrollment trends: who is in class this spring
Graduation counts tell you who finished. Enrollment counts tell you who is in class right now. The two can move in different directions when students switch majors, take time off, or when one class is simply bigger than the next.
National Student Clearinghouse final spring estimates put total undergraduate enrollment at about 15.5 million in 2026 (+1.3% vs. spring 2025). Spring 2025 Current Term Enrollment Estimates put undergraduate enrollment at 15.3 million (+3.5% vs. spring 2024). Those totals are weighted to approximate full national coverage (97.5% of the Title IV universe in fall 2024).
Field mix is shifting at four-year colleges. Clearinghouse reports show computer and information sciences enrollment fell about -8.4% from spring 2025 to spring 2026 at four-year institutions, while health fields continued to grow. In our major-level pull from the NSC appendix, computer science fell about -12.5% (217,482 to 190,285 students). Registered nursing rose about +6.1% over the same span.
| Field | Spring 2025 | Spring 2026 | Change |
|---|---|---|---|
| Registered Nursing | 484,073 | 513,793 | +6.1% |
| Psychology | 423,106 | 423,347 | +0.1% |
| Social Work | 74,494 | 79,790 | +7.1% |
| Elementary Education | 221,371 | 227,730 | +2.9% |
| Business Administration | 649,137 | 654,106 | +0.8% |
| Biological Sciences | 370,201 | 380,807 | +2.9% |
| Computer Science | 217,482 | 190,285 | -12.5% |
| Mechanical Engineering | 169,077 | 187,163 | +10.7% |
Clearinghouse enrollment files by major do not break out sex. Sex concentration by major in this report comes from federal graduation counts. National enrollment by sex (above) comes from Clearinghouse reports (2011–2024).
The payoff gap: what the typical graduate pathway pays
By major, typical pay diverges sharply. Weight those figures by who actually graduated in 2023–24 across 304 bachelor’s majors with public College Scorecard data, and a national picture emerges: the typical pathway women complete pays about $43,359 one year after graduation vs. $48,124 for men (1.1×). That is about $4,765 in typical first-year pay—reflecting different major choices, not two people in the same job being paid differently because of sex.
About 67.7% of women graduated into majors with typical pay below $45,000 (vs. 44.9% for men). About 57.5% of women finished below the median typical pay across those majors ($40,786).
Eight headline fields illustrate the spread in more detail. Five female-skewed majors in this set average about $43,667 in typical first-year pay vs. $71,082 for two male-skewed STEM majors (1.6×, unweighted). Nursing remains the standout among female-skewed rows: strong typical pay with moderate debt relative to earnings.
| Major | Women’s share | Graduates | Typical pay (year 1) | Census pay (year 1) | Census pay (year 5) | Pay growth Y1→Y5 | Debt ÷ year-1 pay |
|---|---|---|---|---|---|---|---|
| Registered Nursing | 86.6% | 153,340 | $75,087 | $70,668 | $84,360 | +19% | 0.29 |
| Psychology | 80.7% | 118,927 | $31,658 | n/a | n/a | n/a | 0.82 |
| Social Work | 88.6% | 18,657 | $37,296 | n/a | n/a | n/a | 0.51 |
| Elementary Education | 90.2% | 51,673 | $41,896 | $41,667 | $52,283 | +26% | 0.55 |
| Business Administration | 46.3% | 160,404 | $45,741 | $47,823 | $67,931 | +42% | 0.49 |
| Biological Sciences | 68.5% | 83,045 | $32,400 | n/a | n/a | n/a | 0.87 |
| Computer Science | 21.6% | 46,155 | $71,458 | $70,371 | $102,715 | +46% | 0.38 |
| Mechanical Engineering | 17.3% | 33,346 | $70,705 | $73,065 | $93,402 | +28% | 0.44 |
Census PSEO earnings data (2016 grad cohort) show pay rising from year 1 to year 5 in several rows, but not equally: computer science grows about 46.0% vs. elementary education about 25.5%. EDsmartData.com publishes broader program-level payoff analysis.
National pathway pay is only half the story. Geography still matters after graduation. Claudiu Pop of CoworkingCafe (part of Yardi), citing the publisher’s 2026 study of 303 U.S. cities, argues that the labor market students enter can amplify—or cushion—major choice:
“Fields where women cluster, like nursing and education, are in demand nearly everywhere, so graduates in those majors can prioritize affordability… Meanwhile, the tech-heavy fields where men cluster are concentrated in expensive, currently volatile markets.”
— Claudiu Pop, CoworkingCafe (Yardi), on the publisher’s 2026 best cities for recent grads study
In that study’s framing, nursing and education graduates can often prioritize more affordable metros because demand is widespread, while male-skewed tech pathways concentrate in higher-cost, more volatile markets. That does not change our Scorecard national medians—but it reinforces the checklist item below: look past enrollment headlines to where the jobs are, not only which major you finish.
Overlap majors: business and biology
Not every high-volume major skews toward one sex. Business administration ranks first for men and third for women in 2023–24 graduations. Biological sciences appear in both top-10 lists. A major’s sex mix does not always map cleanly to “high pay” or “low pay”; business sits mid-ladder on typical pay, while biology feeds both health careers and research tracks with wide earnings spreads.
Use overlap majors as a reminder: the credential gap is national and real, but many students still share the same broad fields of study.
Earnings gaps persist after college
More education raises typical pay for both sexes, but Education Pays 2026 documents that women with bachelor’s degrees still earn less than men with bachelor’s degrees on average. Among full-time, year-round workers age 25 and older in 2024, median earnings were about $71,800 for women and $95,400 for men with a four-year degree (Figure 2.7).
Georgetown CEW models net lifetime earnings for adults ages 25–64 and finds the same direction at the bachelor’s level: about $1.5 million for women vs. $2.5 million for men (women earn about 60 cents on the dollar; Figure 13). From 2010–20, women’s attainment gains were associated with about $8.3 trillion in net lifetime earnings gains vs. about $6.5 trillion for men (Figure 8), even though women still earn less at each degree level.
BLS Current Population Survey data for 2025 show another layer: among adults 25 and older with a bachelor’s degree or higher, about 41.2% of women vs. 38.1% of men hold that credential (3.1 points). Labor force participation is 68.8% for women vs. 75.8% for men with bachelor’s degrees or higher (7.0 points).
Which major you choose explains part of the earnings gap, not all of it. Occupation, hours worked, experience, and discrimination still matter. EDsmartData publishes worker-level breakdowns by gender and education level.
Professional schools: a related pipeline
Undergraduate major mix is only the first stage. NCES Digest, Table 318.10 shows women received about 58.2% of doctor’s and first-professional degrees nationally in 2023–24. Program-level enrollment has shifted too: AAMC reports women were a majority of medical school matriculants starting in 2017–18 (50.7%) and of applicants starting in 2018; the American Bar Association documents women as a majority of law students since 2016.
This report stops at the bachelor’s layer. Graduate and professional programs carry a separate return-on-investment question.
What to check before you commit
- Graduation rates for your program—not just how many people enroll.
- Typical pay one and four years after graduation for your major. Our analysis of College Scorecard data publishes national medians by field.
- Student debt vs. first-year pay on EDsmartData.com—can you realistically pay loans on typical earnings?
- Whether you plan to continue to graduate or professional school (law, medicine, and similar paths have their own ROI).
- Your local job market—national Scorecard medians hide big regional differences in hiring and living costs.
Frequently asked questions
Do women earn more college degrees than men? Yes. Federal counts show women received about 59.6% of bachelor’s degrees in 2023–24. Pew Research Center finds a similar gap among adults ages 25–34. National Student Clearinghouse enrollment estimates also show women as the majority of undergraduates in the seats through spring 2024.
Why do the majors women choose often pay less? Women and men often finish in different fields. In our sample of eight common majors, five that skew female—psychology, social work, elementary education, and similar—cluster at lower typical first-year pay than male-skewed engineering and computing. Nursing is the main exception: it is female-majority and pays well. Expert commentators point to gender role expectations and early major decisions that harden before salary charts enter the picture. This is about which majors pay what on average—not proof that two people in the same major are paid differently by sex.
Does your major explain the gender earnings gap after college? Partly, not entirely. Which field you finish in matters for typical pay, but Education Pays still shows bachelor’s-holding women earning about $23,600 less per year than men on average. Hours worked, occupation, experience, and discrimination still play a role.
What share of women graduate into lower-paying majors? When we weight typical pay by who actually graduated across 304 majors with public Scorecard data, about 67.7% of women completers finished in a major whose typical first-year pay was under $45,000. About 57.5% finished below the unweighted median typical pay across those majors ($40,786). See Limits for methodology.
What is the difference between enrollment and graduation? Enrollment counts who is in class during a term ( Clearinghouse ). Graduation counts who finished a degree (federal IPEDS via NCES ). Women can be a majority in both measures while still concentrating in different majors than men.
How big is the pay gap between female- and male-skewed majors? In eight headline majors, five female-skewed fields average about $43,667 in typical first-year pay vs. about $71,082 for two male-skewed STEM fields (1.6×, unweighted). Nursing pulls the weighted average up because so many women graduate in that field and it pays above typical female-skewed majors.
Related reading
This standalone feature extends Issue 1’s program-level ROI frame from The Future of Higher Education and Work. When debt or non-completion dominate, pair it with Issue 2 on credential failure. The series continues with Issue 3 on AI and skills (scheduled July 25, 2026) and Issue 4 on alternative pathways.
See also whether college is worth it on typical terms and why major choice matters more than campus brand.
Key takeaways
- Women’s lead on college degrees is broad—from bachelor’s through doctorates—not limited to one major.
- Men and women still concentrate in different top majors, and those majors carry different typical pay (Our analysis of College Scorecard data).
- Earning more degrees has not, by itself, closed the worker-level earnings gap between women and men.
- Look at program economics—pay, debt, and graduation rates—not just headlines about enrollment. See Issue 1’s four ROI drivers and Issue 2’s failure points.
Limits
- National degree shares by sex (59.6% female among bachelor’s degrees, etc.) come from NCES Digest Table 318.10. Major-level graduation counts in this report use IPEDS Completions 2023–24 rolled to four-digit CIP series excluding 99.xx programs; that file totals about 2.07 million bachelor’s awards (~58.4% female)—not the Digest national total (~2.14 million).
- IPEDS completions in this build are a single year (2023–24). We do not publish multi-year female-share trends by CIP yet.
- Sex shares and completer counts use bachelor’s degrees (IPEDS AWLEVEL 5) rolled up to four-digit CIP series—the same grain as our top-majors-by-demographics page.
- National payoff analysis weights typical year-1 pay by completer sex across all majors with Scorecard data; the “below median major” threshold uses the unweighted median of field-level typical pay figures, not a completer-weighted median.
- Scorecard CIP4 medians use national program medians where published; where absent, our pipeline uses a proxy rollup (see EDsmartData Scorecard processing).
- Professional-school enrollment (law, MD, DVM, pharmacy) comes from association sources cited in prose, not from our pipeline.
- Scorecard program medians are not split by graduate sex; sex breakdowns are from IPEDS completions, earnings from Scorecard/PSEO.
- CEW lifetime earnings are modeled net lifetime pay (ACS ages 25–64), not the same as Scorecard one-year program medians or Education Pays annual medians.
- NSC CIP appendix files report spring enrollment by field, not by sex; sex-by-field patterns come from IPEDS completions.
- NSC enrollment-by-sex: spring 2011–2024 and fall 2010–2023 (PDFs plus CTEE xlsx appendices). Spring 2025 gender is dashboard-only until NSC publishes a demographics appendix.
- NSC national enrollment estimates are coverage-weighted; for-profit sector coverage is much lower than public sectors—see nsc_reference coverage rates.
- Expert commentary (July 2026 outreach) reflects each source’s views and experience; EDsmart did not independently verify every claim. CoworkingCafe city labor-market figures are from that publisher’s 2026 study, not from our IPEDS–Scorecard merge.
Sources & methodology
We combined federal graduation counts (IPEDS 2023–24), typical pay and debt from the College Scorecard, Census earnings data, and National Student Clearinghouse enrollment estimates—linking who graduates in each major to what those programs typically pay. Interactive tables are on EDsmartData.com.
- EDsmartData.com — IPEDS completions and Scorecard program outcomes used in this report.
- U.S. Department of Education College Scorecard — program outcomes by CIP.
- NCES Digest of Education Statistics, Table 318.10 (2023–24 degree counts by sex); Table 104.20 (25- to 29-year-old attainment by sex, cited via Education Pays).
- College Board Education Pays 2026 (median earnings and attainment; underlying CPS data via Census).
- Pew Research Center, U.S. women outpacing men in college completion (2024; CPS-based).
- Georgetown University Center on Education and the Workforce, Learning and Earning by Degrees: Gains in College Degree Attainment (2024).
- U.S. Bureau of Labor Statistics, CPS Table 7 — employment status by education and sex (2025 annual averages).
- National Student Clearinghouse Working With Our Data (coverage rates); Current Term Enrollment Estimates (enrollment by sex); Final Spring Enrollment Trends (Spring 2025 / 2026 CIP appendices).
- U.S. Census Bureau LEHD Post-Secondary Employment Outcomes (PSEO).
- Professional-school enrollment context: NCES Digest Table 318.10 (doctor’s / first-professional degrees by sex); AAMC FACTS (medical school applicants and matriculants); American Bar Association (women in the legal profession).
- Expert commentary (July 2026): E. Michele Ramsey (Penn State Berks); Sergio Pantoja Torres and Lidija Elezovic (Education World Wide); Claudiu Pop / CoworkingCafe best cities for recent grads (Yardi).